
79 of 1,000
rounds returned more than their stake.
56.9%
of returned credits came from five rounds.
53 rounds
in the longest sequence with no above-stake payout.
A payout is not always a profit
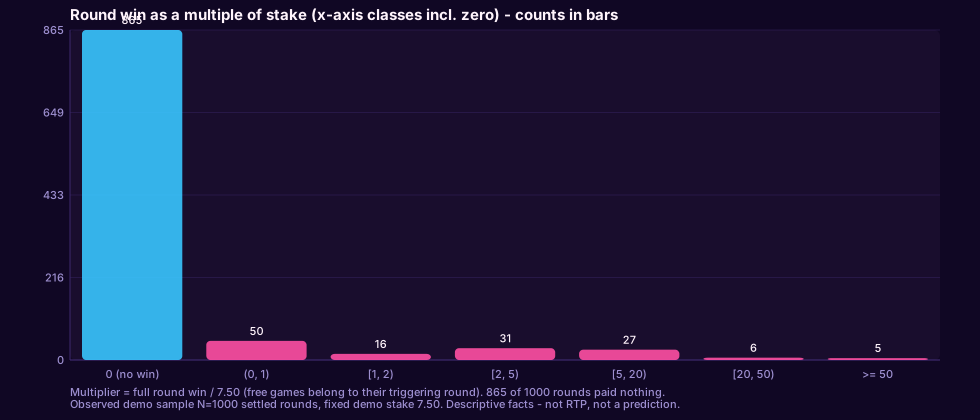
Only 79 rounds (7.9%) returned more than their own stake. A payout below 7.50 credits still loses credits on that round; returning exactly the stake breaks even.
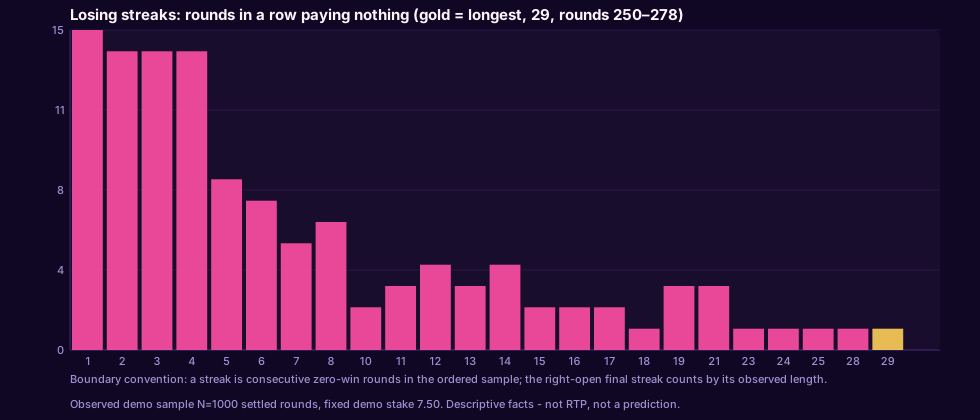
The longest sequence with no above-stake result was 53 rounds, #358–410. This differs from the 29-round sequence with no payout at all.
Five rounds dominated the recorded returns
The five largest round payouts contributed 56.9% of all returned credits. All five included free games. These are recorded outcomes, not a prediction of future concentration.
Sample sensitivity
| Largest payouts removed | Share of payouts | Original 1,000 stakes retained | Remaining rounds only |
|---|---|---|---|
| 1 | 19.2% | 95.0% | 95.1% |
| 5 | 56.9% | 50.7% | 51.0% |
| 10 | 67.8% | 37.8% | 38.2% |
A descriptive counterfactual: the first return column keeps all 7,500 credits staked; the second removes the corresponding stakes too. Neither calculation is an alternative RTP.
Explore a recorded round
Check the payout, session and feature status of any audited CSV round. This viewer does not replay gameplay or draw missing reels.
Enable JavaScript to use the round viewer, or read the complete CSV.
Compare the ten recorded sessions
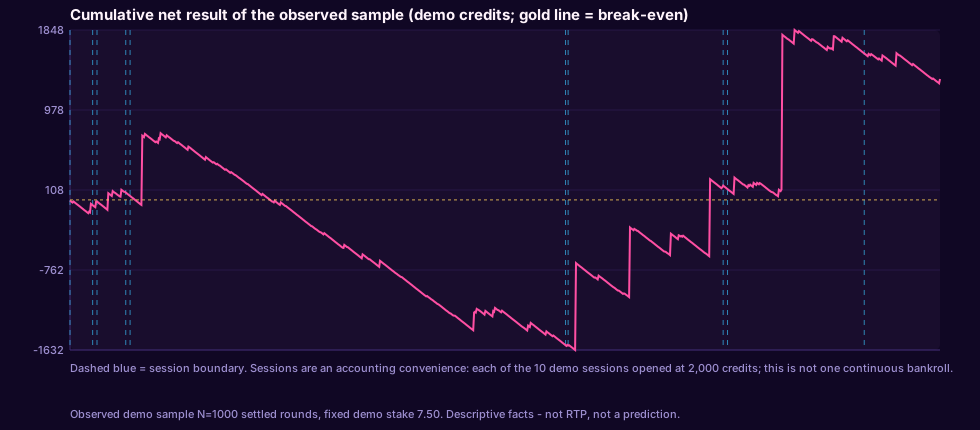
Session sizes differ substantially. Each session had a separate demo balance; the cumulative line is an analytical sum, not one continuous bankroll.
Choose a session to inspect its recorded path. Full summaries remain available below.
The line starts at zero net credits. Pink markers identify observed feature rounds. The vertical scale adapts to each session; compare the numbers, not apparent slopes.
| Session | Rounds | Net credits | Observed return |
|---|---|---|---|
| session-01 | 26 | -50 | 74.4% |
| session-02 | 5 | 32,5 | 186.7% |
| session-03 | 33 | 105 | 142.4% |
| session-04 | 5 | -37,5 | 0.0% |
| session-05 | 500 | -1 622,5 | 56.7% |
| session-06 | 3 | -5 | 77.8% |
| session-07 | 178 | 1 715 | 228.5% |
| session-08 | 5 | -12,5 | 66.7% |
| session-09 | 157 | 1 475 | 225.3% |
| session-10 | 88 | -285 | 56.8% |
Only 4 of ten sessions ended above their recorded stakes. Session-05 contained 500 rounds (#70–569), returned 56.7% and lost 1,622.5 credits. After its feature at #105, its remaining 464 rounds contained no new trigger.
Average bonus versus median bonus
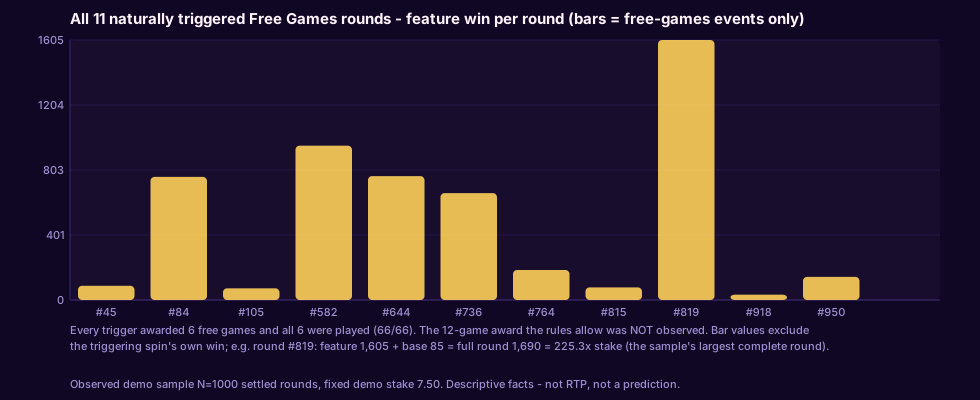
Across the eleven observed features, free-game payouts ranged from 32,5 to 1 605 credits. The mean was 485,45; the median was 185. The largest feature contributed 30.1% of feature payouts. A median describes this sample, not a “typical” future bonus.
| Round | Base credits | Free-game credits | Total credits | Total × stake |
|---|---|---|---|---|
| #45 | 100 | 87,5 | 187,5 | 25.00× |
| #84 | 0 | 760 | 760 | 101.33× |
| #105 | 0 | 72,5 | 72,5 | 9.67× |
| #582 | 0 | 952,5 | 952,5 | 127.00× |
| #644 | 0 | 765 | 765 | 102.00× |
| #736 | 185 | 660 | 845 | 112.67× |
| #764 | 0 | 185 | 185 | 24.67× |
| #815 | 0 | 77,5 | 77,5 | 10.33× |
| #819 | 85 | 1 605 | 1 690 | 225.33× |
| #918 | 0 | 32,5 | 32,5 | 4.33× |
| #950 | 0 | 142,5 | 142,5 | 19.00× |
All eleven observed features awarded and completed six free games with no additional stake. We did not observe the provider’s twelve-game award. The separate development case A illustrates locked symbols; it is outside this audited sample.
How long we waited for each feature
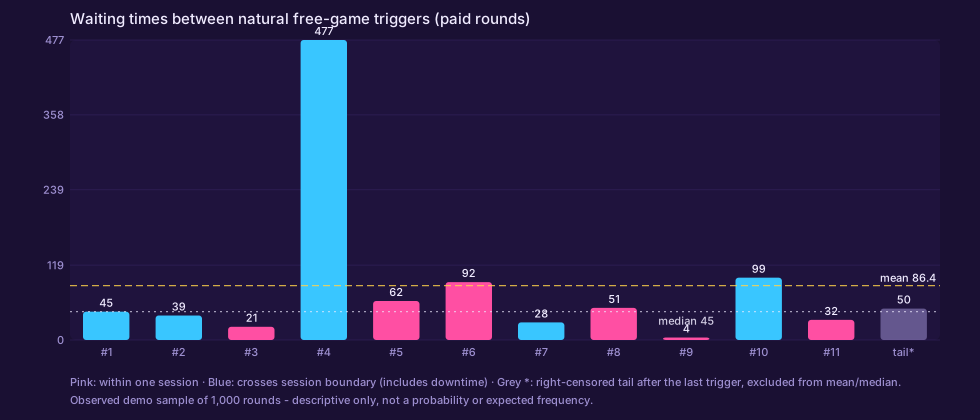
Every natural trigger below is recomputed from the recorded rounds, not from memory - the same reproducible script that builds this table also writes the analysis file and chart. One interval = the paid rounds from the previous trigger up to and including the triggering spin; the first interval counts from the start of the sample. A trigger round settles only after its six free games play out, so each wall-clock span also contains that trigger's own feature run (34–163 seconds, measured from the raw exchanges).
| # | Trigger round | Session | Paid rounds waited | Collection wall time | Feature run |
|---|---|---|---|---|---|
| 1 | 45 | session-03 (crossed) | 45 | 8.4 min | 45 s |
| 2 | 84 | session-05 (crossed) | 39 | 14 min | 81 s |
| 3 | 105 | session-05 | 21 | 5.1 min | 41 s |
| 4 | 582 | session-07 (crossed) | 477 | 78.4 min | 97 s |
| 5 | 644 | session-07 | 62 | 11.7 min | 131 s |
| 6 | 736 | session-07 | 92 | 16 min | 75 s |
| 7 | 764 | session-09 (crossed) | 28 | 17.4 min | 34 s |
| 8 | 815 | session-09 | 51 | 10 min | 34 s |
| 9 | 819 | session-09 | 4 | 4.3 min | 163 s |
| 10 | 918 | session-10 (crossed) | 99 | 30.6 min | 42 s |
| 11 | 950 | session-10 | 32 | 5.8 min | 44 s |
- Completed sample gaps, across collection sessions. Average: 86.4 paid rounds (median 45). The eleven completed gaps ranged from 4 rounds (rounds 815→819) to 477 (105→582). In our collection pacing that meant an average of 18.3 minutes of wall time (median 11.7) - our scripted pace with deliberate delays, not what a normal player would experience, and not the game's expected frequency.
- Session breaks are real time. Rows marked "(crossed)" span session expiries, cooldowns and restarts - the 477-round gap includes about 46 minutes of plain downtime between collection runs. Counters reset with every fresh 2,000-credit session, so these are observed aggregates, not one continuous sitting.
- After the last trigger the sample went quiet. Rounds 951–1,000 are 50 paid rounds (7.7 min) with no trigger. That tail is reported separately and excluded from the average above - the sample ended before a twelfth feature.
- Two different denominators, both descriptive. The overall sample density is 11 triggers in 1000 rounds - about one per 90.9 rounds - which is not the same figure as the 86.4-round average of completed waits. Neither is a probability: a long gap does not bring a feature closer.
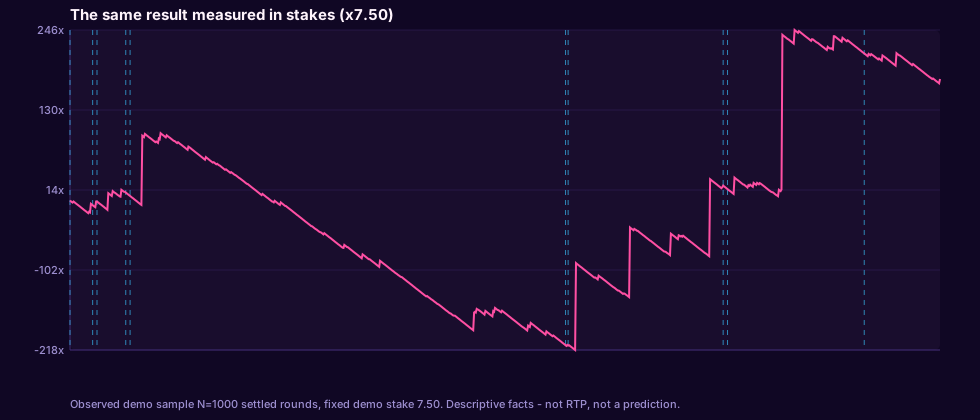
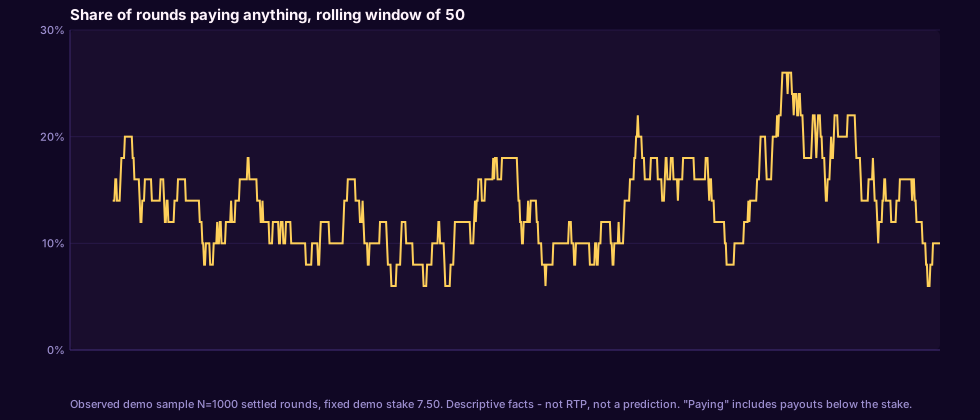
More charts from the same recorded sample
How we recorded it (methods, briefly)
- Ordinary public demo sessions through the official client interface - one session at a time, normal click pacing, no injected responses, no forced outcomes and no modified files.
- Every request/response pair was saved exactly as received; each record is hash-checksummed. The validator re-verified all 1,066 exchanges, every balance transition, and that no round was double-counted before this page's numbers were written.
- Ten sessions contributed completed rounds. An eleventh attempt recorded no rounds and is not represented in the CSV. A fresh demo session starts at 2,000 credits. We treat each session separately rather than pretending it is one continuous bankroll.
- Incomplete rounds would have been quarantined and excluded; in this sample none occurred.
Download the recorded round data
Reproduce the calculations: download the analysis module and CSV into the same directory, then run node --input-type=module -e "import {readFileSync} from 'node:fs'; import {parseCsv,analyze} from './analyze.mjs'; console.log(analyze(parseCsv(readFileSync('rounds-1000.csv','utf8'))));". It calculates the same payout groups, sessions, streaks, concentration and bonus summaries shown above.
Every figure above comes from the same whitelisted export you can check yourself: the 1,000 settled rounds with no tokens, account identifiers, backend IDs or raw request envelopes - those stay private. Cash fields are demo credits, not rand.
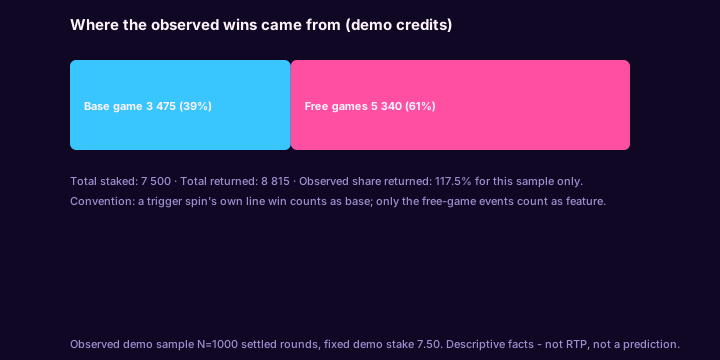
The manifest holds the full SHA-256 of each file (CSV 9d2d6d8f…) plus the private analysis dataset's checksum 44aff0848d8ef74a… - separate values: the export is a derived public view, not the raw record. The export regenerates from the audited dataset by script; its arithmetic (base + feature = total for every row; 11 features; 66 free games; totals 7,500 / 8,815 / 3,475 / 5,340) is re-verified on every run.
What this evidence cannot tell you
- No RTP estimate. 1,000 rounds is far too small; the observed 117.5% is luck, not a property of the game.
- No "how often features hit" rate. 11 triggers in 1,000 rounds (1.1%) is a sample fact, not a probability.
- No funded-play proof. We never deposited, and demo results do not establish what a rand account would pay out.
- No strategy. Nothing in the data supports timing, pattern or stake-progression systems.
Dataset checksum (SHA-256, first 16): 44aff0848d8ef74a - you can use it to confirm that any copy of our round record is the one this page describes. Figure captions on this site say where each image comes from: frames marked “captured by us” were taken while we played the official Habanero demo; other images are provider-supplied screenshots or artwork, labelled as such. All numbers on this page come from the recorded exchanges described above. For the rules-side evidence, see the feature guide, which pairs the provider's rule panels with what we observed.